 |
| This is the set up for a BJT curve tracer. It contains two voltages that vary differently as they have different effects on each other as they travel through the BJT. |
 |
| This is the effects of a change in the resistance on the circuit. The wavelength is constant but the amplitude is decreased. |
 |
| This is a closer look at the BJT Curve Tracer set up. It has one voltage source that is DC and the other is a step voltage source. |
 |
| This is the set up of the circuit. The graph is what is expected to see from the voltage out of the transistor. |
 |
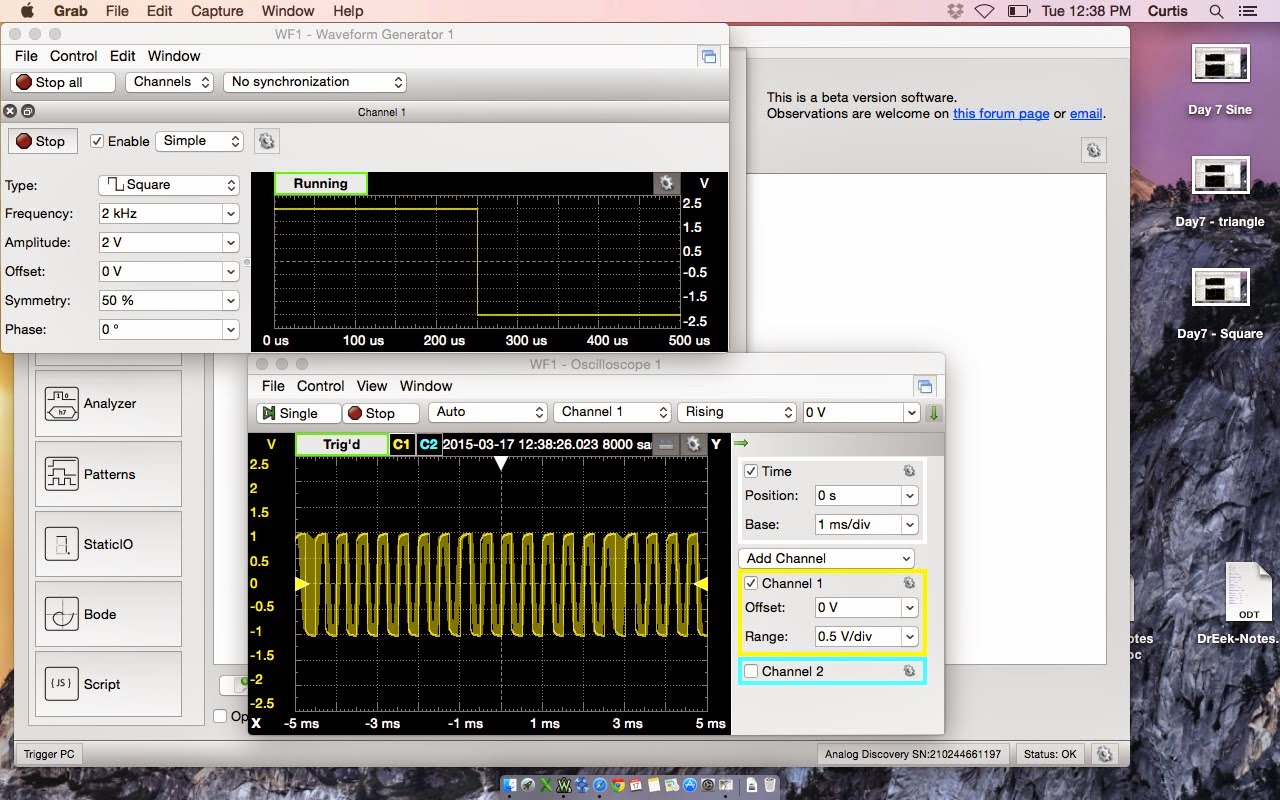
| This the view of the voltage coming from the waveform and the oscilloscope measuring the output. |
 |
| Using a triangle voltage supplied from the wave form, the oscilloscope measures a triangular wave output. |
 |
| This waveform uses a sinusoidal wave. The oscilloscope measures a sinusoidal wave. |
 |
| This is the graph as the voltage is stepped up and it reaches its limit across the transistor. |
No comments:
Post a Comment