Thursday, May 21, 2015

5-7-15

This is looking impedance of different circuits. Using the equation for impedance in an inductor to be j imaginary * natural frequency * inductance. The impedance of a capacitor is the inverse of j imaginary * natural frequency * capacitance. 

This is all three of the circuits built on one bread board, so that each circuit could be looked at one after another with ease. This is to calculate the voltage of the circuit

This graph is through the inductor. It shows how the inductor is fighting the change in the voltage. It oscillates about 0V while the voltage through the resistor oscillates through what looks like a DC offset because of the voltage that the inductor is fighting. This has a frequency of 500 Hz.

This is the same circuit only in this case the frequency is 1K Hz.

This is the current through the resistor verses the voltage from the capacitor. So the current is decreasing the voltage is being being released from the capacitor. This allows this seeming mirror image. This beautiful graph. Like artwork.

Sunday, May 17, 2015

4-30-15

This is the circuit with a capacitor in parallel with a resistor and an inductor. It is measuring the voltage only through those parallel components. This lab is a question on my second celebration. I got a number of things wrong on this lab as well as getting things wrong on the celebration.

This is a good example of why I should have my labs done on time.

This says that the circuit is overdamped.  The graph of the voltage says other wise. Implying that there is some miscalculation in the neper frequency and the natural frequency. The correct equation should have been e^at(Acost(wt) + Asin(wt)). Then solve for A and B using initial value amounts.

This circuit is underdamped. Even though on the previous screen we say that it is over damped. 

4-28-15 : AC RLC circuit

This is a basic RLC circuit, using a waveform generator to produce a sinusoidal wave function for an AC voltage source. This is a second-order circuit. in this case alpha is less than omega so we expect an underdamped case.

This is the prelab. Though it does not include the equations for s1 and s2. The equation for underdamped i(t) = e^(-at)(B1coswt+b2sinwt) 

This graph shows the underdamped response.

4-21-15

This circuit uses a capacitor with an inverting op amp.

This is the schematic for the op amp and the inverting amplifier. The theoretical output voltage was 2 pi multiplied by the frequency, the resistance, the capacitance, and the amplitude. It then oscillates in a sinusoidal wave. 

This is the graph of the output voltage at 1kHz frequency. You can see that the max is approximately 1.22 V. There is a small amount of excess noise, but the voltage is very consistent.

When the frequency is 2kHz, there appears to be a lot more noise. This has to do with the increase in amplitude and in increase in frequency.

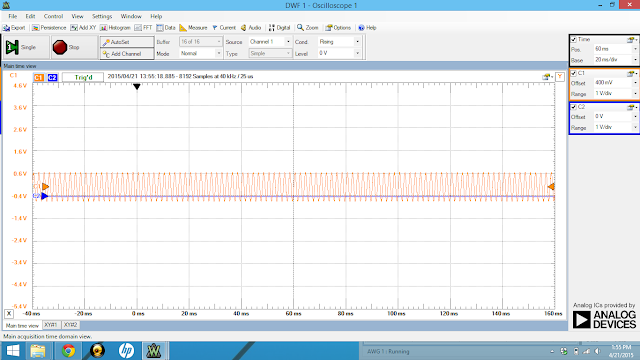
This a very neat graph at 500Hz. It looks very boring and simple and it has a small amount of voltage.

4-16-15


Saturday, May 16, 2015

4-14-15


4-9-15: wheat stone bridge.


3-31-15: Summing Amplifier

Recall: this is a diagnostic of an op amp. It will simply mirror what is put into it and what comes out as long as it does not exceed the power that is supplied to the op amp.

This is a practice problem to demonstrate the voltage produced by the op amp. Recognizing that there is no voltage on either input and using nodal analysis and KCL.
This is the schematic for a summing amplifier. First we built it using every circuit using a set resistor. Then we built the circuit on a bread board and adjusted the initial voltage while keeping the second voltage steady. We found that the op amp saturated at -3.49 and 4.23. I also found out that my team supports my eating habits and also they like standing waves.

This is the actual Circuit.