Saturday, May 16, 2015

3-31-15: Summing Amplifier

Recall: this is a diagnostic of an op amp. It will simply mirror what is put into it and what comes out as long as it does not exceed the power that is supplied to the op amp.

This is a practice problem to demonstrate the voltage produced by the op amp. Recognizing that there is no voltage on either input and using nodal analysis and KCL.
This is the schematic for a summing amplifier. First we built it using every circuit using a set resistor. Then we built the circuit on a bread board and adjusted the initial voltage while keeping the second voltage steady. We found that the op amp saturated at -3.49 and 4.23. I also found out that my team supports my eating habits and also they like standing waves.

This is the actual Circuit.


Saturday, March 28, 2015

Day 10: Inverting Voltage Amplifier

This is the inverting op amp circuit. By changing the voltage in and measure the effects of the op amp. so that the saturation can be seen as well as the voltage that seeps in from the source when the voltage input is zero.

This is the break down of the Op Amp as though it where two seperate components that are just proportionally reliant on each other. The voltage across the resistor and the voltage from the source. Gosh there is so much stuff going on here, It hurts to look at the day before the celebration.

This is the circuit itself using the Op Amp. You can see the source supplied and and the oscilloscope measuring the resistance. I hope there are not any questions about how to use waveform, I would be in trouble. Time to sleep so I have energy to Celebrate tomorrow.!!!!! CELEBRATE GOOD TIMES COME ON!!!!

Day 9: Maximum Power Transfer and Non-Ideal Power Source

This is showing that the resistance that creates the maximum power is when the resistance in the thevenin circuit is equal to that of the thevenin resistance.

This is calculating max power in a circuit.

This is the prelab is used to set up the equations required to calculate the resistance due to the voltage source coming from the analog discovery. it uses a system of equations to measure the adjustment to the system brought on by the voltage source making sure that in one situation it is equal to zero and then changing the resistor.

This is the circuit using the wavefunction to generate a voltage and measure the current. and to measure the resistance inside of the analog discovery.

Day 8: Thevenin's Theorem

This circuit is simplified to measure the one resistance and the one voltage so that as you change one resistance it is easier to calculate its effects on the system.

This is all the work, measuring all the components so that theoretical and experimental can be seen simultaneously. The thevenin resistance and thevenin voltage effects as one resistor is changed and how the voltage across it will change accordingly.

This is everycircuit, it should the current and voltage throughout a theoretical circuit. 

This is the circuit that is used for the experiment using a potentiometer to change the resistance.


This is the thevenin circuit.


Day 7: Time Varying Signals

This is the set up for a BJT curve tracer. It contains two voltages that vary differently as they have different effects on each other as they travel through the BJT.

This is the effects of a change in the resistance on the circuit. The wavelength is constant but the amplitude is decreased.

This is a closer look at the BJT Curve Tracer set up. It has one voltage source that is DC and the other is a step voltage source.

This is the set up of the circuit. The graph is what is expected to see from the voltage out of the transistor.

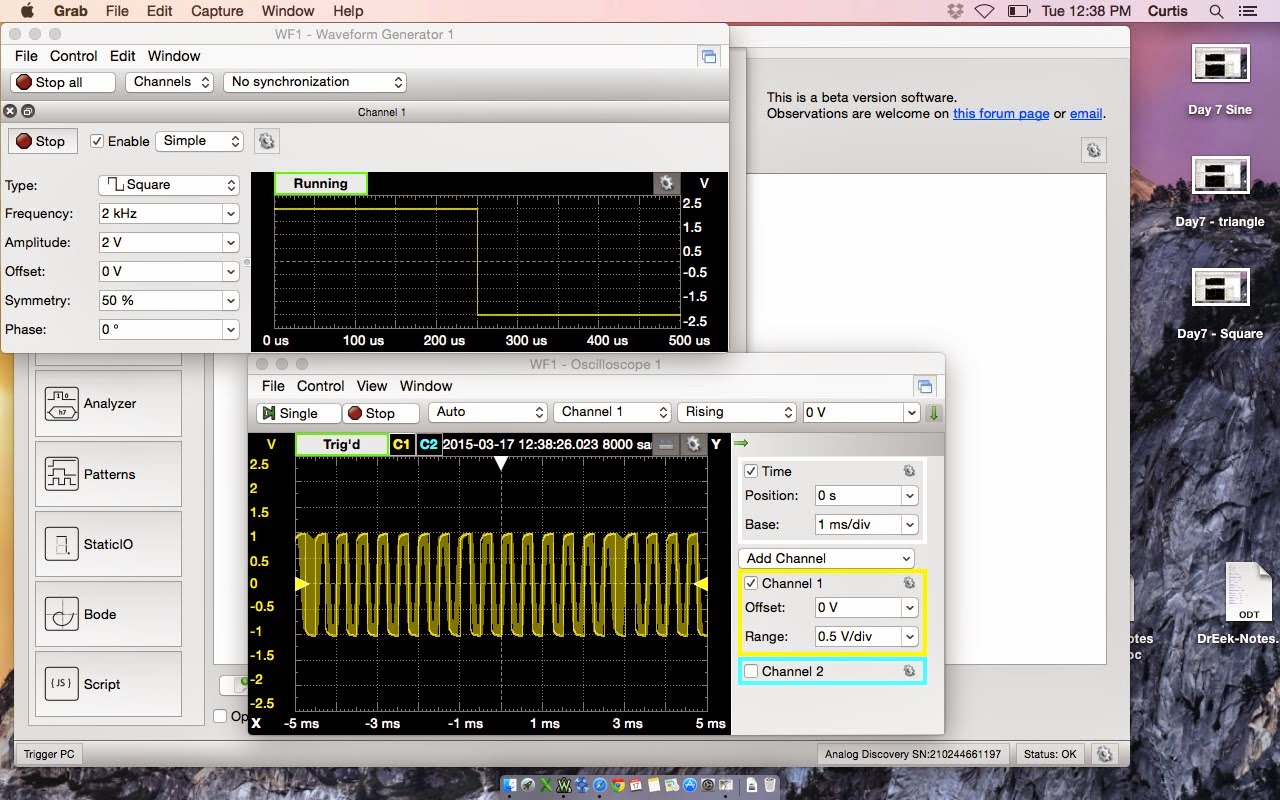
This the view of the voltage coming from the waveform and the oscilloscope measuring the output.

Using a triangle voltage supplied from the wave form, the oscilloscope measures a triangular wave output.

This waveform uses a sinusoidal wave.  The oscilloscope measures a sinusoidal wave.
This is the graph as the voltage is stepped up and it reaches its limit across the transistor.


Day 6: Nodal Analysis III

Even though this lab is called Nodal Analysis. I am doing Mesh Analysis. Cause I am my own boss.

This is a super Mesh, in which the current source is removed. It would be really crazy if there was a question on the celebration tomorrow that required a source conversion and then a super mesh or a super node. I am ready. 

This circuit contains three full loops that cover each of the circuit components in the smallest loops possible.

The voltage drop is measure across a resistor.

Every piece of the circuit is analyzed. This has a theoretical voltage across the resistor and then the measure voltage across the resistor in order to create a percentage uncertainty.

Day 5: Nodal Analysis

This is an example of nodal analysis. Using I=V/R and looking at currents coming and leaving at a node to calculate voltages as the current is conserved.

This is a circuit using three resistors and measuring voltage.

This circuit allows for the measurement of the voltage at the node 2 using nodal analysis and then measuring the value and using % error as theoretical versus experimental.